Google Data Studio and Google Sheets are tools that can be used in the present day for having for building a near real-time dashboard. Having a dashboard, which shows the figures for business operations is a wish for every business owner, irrespective of the scale he is operating.
A business owner wants to have the figures related to sales, production, and inventory to take the necessary decision for the continuous operation of his unit. Building an application that displays any real-time time figure collected from the field is a complex task where you need to have a server that enables the field personnel to enter the relevant information and then build a mobile application to fetch the data. This process has expenditure involved in the hosting and development of mobile applications.
Google has been providing tools that avoid the hassle of purchasing hosting and hiring a developer. With the help of google sheets and google studio, google has enabled the non-programmers to build a dashboard that displays the KPI (Key Performance Indicator).
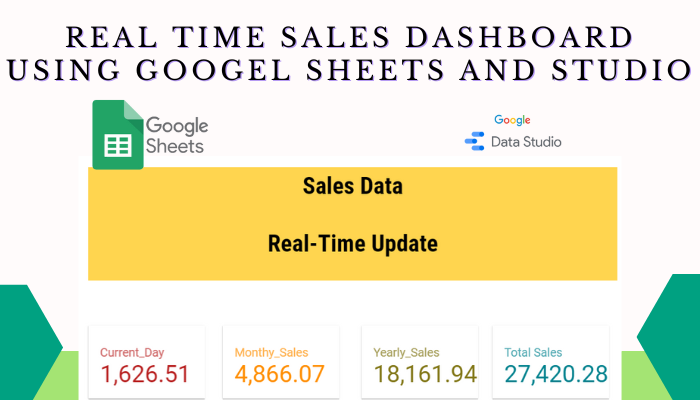
I demonstrate the steps to build a dashboard that will look like this

To build the dashboard we need
-
Google Account
-
Data in Google Sheets
-
Google Data Studio
I assume that you have a google account, if not create one and then follow the next step
Requirements in Google Sheets
To build the google dashboard, I am using google sheets as a database,
Login to your google account and create a new google sheet and paste the sales data available in the excel file which can be downloaded from here. and rename the sheet as “Master” which will fetch the total sales to date.

Now insert a pivot table for the table data in new sheets and rename it as “C_Date” and drop the region and total sales fields in the rows section of the ” PIVOT TABLE EDITOR “. As I am interested to have a display of current-day sales. This data contains the date field, this has an advantage that I will explain later. Now filter the data in the date section which you will find in the “PIVOT TABLE EDITOR” section, which has the option of date equal to today.

After applying the filter condition sheet will display only the current-day sales as below.

Similarly, insert 2 new pivot tables with the same fields
Rename one sheet as the “C_Year” and apply the filter by condition on the date filed to show current year sales. (calendar year) and enter the formula “DATE(YEAR(TODAY(),1,1))-1” . This filters the data from the 1st Jan of the running year.

Rename another sheet as the “C_Month” and apply the filter by condition on the date filed to show the current month’s sales. (calendar year) and enter the formula “EOMONTH(TODAY(),-1)“.This filters the data from the 1st of the running month.

After generating these 3 sheets now let’s move to the Google Data Studio.
Requirements in Google Data Studio.
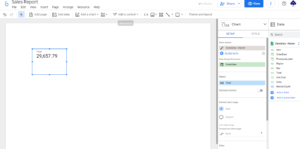
As soon as you open the google data studio click on the blank report.

After clicking on the blank report it will create a blank canvas or dashboard where we will display our current-day sales, current-month sales, current-year sales, and total sales. At the same time, it will ask you to connect your data source.

At the same time, it will ask you to connect your data source. Then Click on google sheets and select the SalesData Sheet file from the list of available files and then select the Master Sheet and click on ADD, from where we will get the total sales. The default report will look somewhat like this.

Select the table and hit delete. On the right-hand side, we will find the chart and data sources. Now on the toolbar of the dashboard, you will find “Add Chart”, click on it and then click on the scorecard.

As soon as you click on the scorecard and place it in the appropriate position on the dashboard. The right side layout changes. By default, it shows the record count of the data source.

Now on the right side under the Chart pane –> under SETUP –> you will find
- Data Source
- Date Range Dimension and
- Metrics
Data Source: Shows the connection of the Google Sheet file along with the “Master” sheet
Metrics: section which by default shows the record count. Click on it and it changes to a list of available header fields, select Total from the drop-down or just type Total or you can drag and drop from the Data Pane, which is seen like this
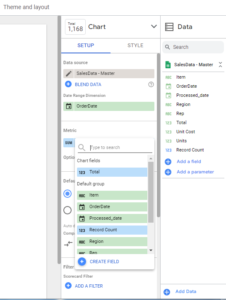
As soon as you change the field the scorecard will show the total sales of the available data irrespective of year.
Now click on the ADD button under the Data Pane on the right-hand side. Again the same data connection screen will appear, this time select the same google sheet file with sheet “C_Year” to get the sales of the current year, click on ADD

After this, the Data pane shows another google sheet with sheet C_year. Now to display the current year’s sales figures go to Add a chart in the toolbar and select “Score Card” from the available options and place it in the appropriate location on the dashboard and click on it. Then go to the Chart pane and Data Source Section and click on edit to select the relevant year sheet.

Select the SalesData – C_Year from the Data Source section. Under the Metric section edit the field to Total, this will show the current year’s sales. With the Option available on Chart –> Style for styling we can make the dashboard look like this

Similarly, Add the other two sheets of the google sheet to display the current day and current month’s sales. After adding two sheets add two scorecards for displaying the two values. After adding some styling and text to the dashboard it would look like this.
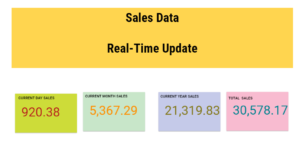
Ta-da the near-time dashboard is ready. Google Studio automatically updates it every 12 hours, if we want to schedule the update we can have a chrome extension that will update as per the settings.
The reason we created 3 different pivots tabled from the main is that google data studio doesn’t have any such feature to show the latest date values, this is a workaround to achieve.
Google has developed amazing tools that will be helpful for small business owners or small projects.
The sheets we connected to the data studio refresh in different intervals (15 min, 1 hour, 4 hours, and 12 hours) we can choose 15 min for a quick update.
Google Data Studio dashboard automatically refreshes in 12 hours, however, if we want to update just refresh the browser which can be achieved by browser refresher extensions
Hope this would help those who are in need of it. I am sharing a link to the Dashboard (click here )(which may not show the current month, date, and year sales if you open it after a year of posting this article) and the Google sheet (click here )
Please find a video link to the above demonstration. Sorry for the low quality
https://youtu.be/ivcuoxGUSo8